A few weeks back, I got a sneak peak at the new VDI Dashboard product from Xangati. They had given us a very quick overview of it at Tech Field Day 5 but I got a special one-on-one opportunity to get a product demo. What follows is information about what I saw.
With virtualization become such a hot topic in today’s IT environments, it’s only natural that people want to extend the benefits of centralized management and reduced hardware expenditure costs to the desktop level as well. VMware is accomplishing this through the Virtual Desktop Infrastructure (VDI), which allows end user desktops to be virtualized and loaded on less powerful hardware. The main processing is done on the back end by the vSphere for Desktops servers and presented to the users via PC over IP (PCoIP). This allows the user to experience the same desktop they would normally have, but make it portable across a variety of devices. This kind of reminds me of the ultimate extension of a roaming profile, only in this case the profile is your whole computer.
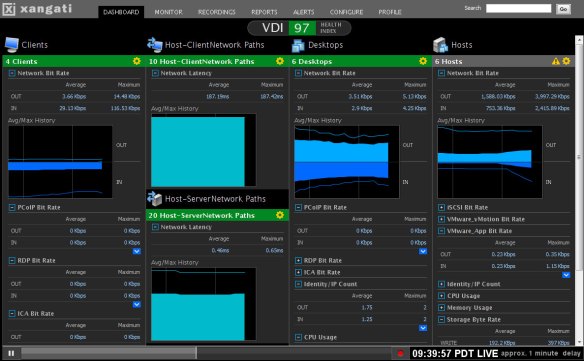
This process isn’t without issues, though. Before, the network was merely a transport medium for data moving from PC to server or PC to the Internet. However, when you abstract the operation of a PC to the point where it requires the network to operate, there can be an entirely new set of variables introduced into the troubleshooting process. Even things that we might normally take for granted, like watching a video, become bigger issues when the network is introduced as a medium for transporting all the data to a user endpoint. Factor in that the virtual team is usually not integrated with the network team, and you end up with a situation that often results in finger-pointing and harsh words. What’s needed in the ability to gather information quickly and easily and display it in an easy-to-read format for the team that might be troubleshooting the issue. Enter Xangati and their VDI Dashboard:
This product gathers information from various different points in your VDI as well as your network and displays it in easy to decipher graphs and tables. For those in more of a hurry, the health index at the top allows at-a-glance digestion of the overall health of the VDI system. When everything is working as it should, this number will be nice and green. once problems occur and monitoring thresholds are triggered, the color will go from worrisome yellow all the way to problematic red. This all occurs in real time, so you can keep up with what goes on as it happens. This is useful if you have a group of people that all come to work at the same time and spool up 10 or 20 new VDI systems as they log on for the day. You can view the impact this has on your VDI and network from the dashboard. You can also see when a user may have an adverse impact on the system from doing something they consider innocuous, such as watching an HD video and consuming much more PCoIP bandwidth than their non-video neighbors.
In addition, the DVR-like functionality present in Xangati’s other products is extended here as well. You can “rewind” the view to a point where the problems started occurring and begin troubleshooting from ground zero. This is a decided advantage because as busy network rock stars, we aren’t always staring at our Single Pane of Glass (SPoG) when a problem happens. The ability to backtrack and see all the events leading up to the problem gives us the ability to take decisive corrective action quickly and efficiently.
Tom’s Take
I don’t have a large VDI setup to manage, but if I did I would consider the VDI Dashboard closely. It’s got a great view for all the things that could cause your deployment to go haywire. Easy to read with tons of great information about all the individual components that comprise the total VDI, this tool makes it very simple to diagnose issues and take corrective steps quickly to limit impact on your users. I haven’t played with it myself, but what I’ve seen makes me happy to know that when my users reach the point where I need to virtualize their Facebook Interface Terminals and LOLCat Creation Devices, I can count on Xangati and their VDI Dashboard to give me up-to-the-minute information.
If you’d like to learn more about Xangati, you can check out their website at http://xangati.com. You can also follow them on Twitter as @XangatiPress.
Disclaimer
Xangati gave me a one-on-one presentation prior to the release of their product and provided me with a press kit containing the image above. I was under no requirement to write an article describing my briefing. The opinions and views expressed in this review are mine and mine alone.


